When we say that R50,000 in branding gear drove R2.5 million in sales, that might sound like marketing fantasy. But for us at Event Branding, it’s a real-world illustration of event ROI done right. In this post, we’ll walk through how to calculate that ROI, step by step, using a simplified event roi calculator model. More importantly, we’ll show you why investing in durable outdoor branding (like our gazebos, umbrellas, banners, and counters) isn’t just aesthetic—it’s measurable business growth.
Whether you’re a corporate event planner in Cape Town, Johannesburg, or anywhere in South Africa, this will help you justify the return on investment (ROI) for your marketing campaign.
The Scenario: R50,000 Branding Investment → R2.5M in Sales
Imagine this scenario:
- You invest R50,000 in branding assets for an outdoor activation (gazebos, flags, counters)
- Because these items are reusable for future events, your marketing expenses beyond this are minimal
- That exposure leads to R2,500,000 in product sales
On paper, that’s a 50× multiplier on your investment. But to treat this as serious ROI—and not wishful thinking—we need a sound methodology.
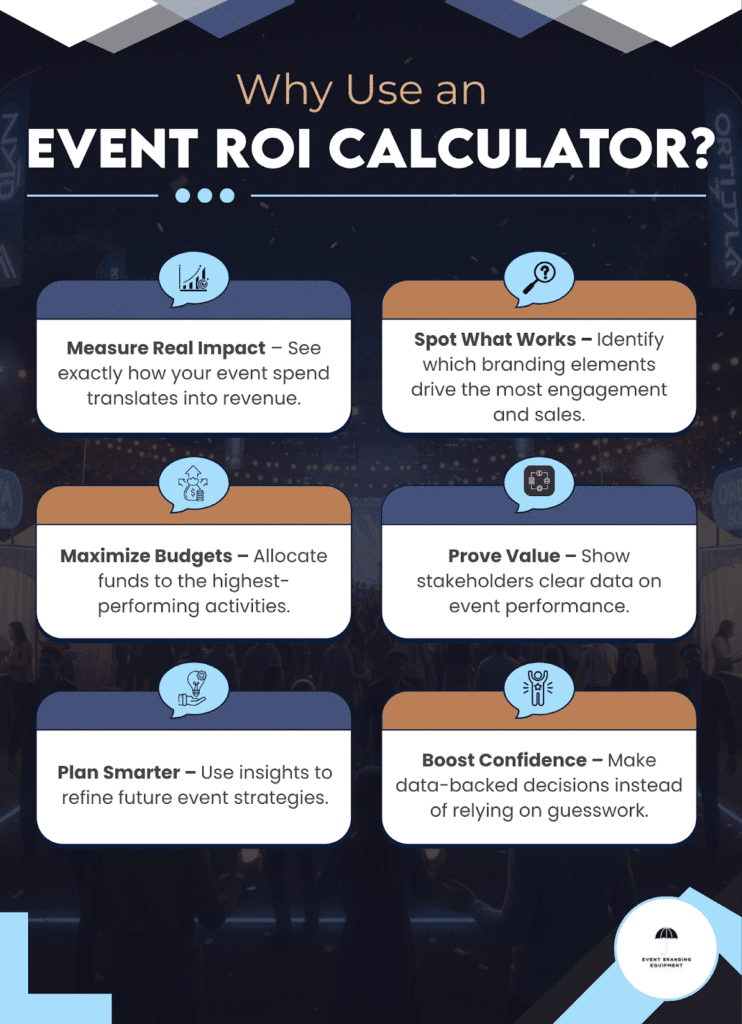
Why Use an Event ROI Calculator?
The ROI Calculation: Formula and Steps
Here’s a way to calculate event ROI in a straightforward way:
- Total Revenue Generated – sum of new sales attributable to the event
- Total Costs – branding, logistics, staffing, rentals, etc.
- Subtract marketing costs from total revenue to get the net gain
- ROI = (Net Gain ÷ Total Costs)
- Convert to percentage or multiplier (×)
So:
ROI = (Revenue Generated – Total Costs) ÷ Total Costs
In our case:
- Revenue Generated = R2,500,000
- Total Costs = R50,000
- Net Gain = R2,500,000 − R50,000 = R2,450,000
- ROI = R2,450,000 ÷ 50,000 = 49 × or 4,900 %
That’s a simple ROI of 49×, or 4,900 %. That’s obviously higher ROI than most campaigns — but the point is, you can calculate the ROI back-of-the-envelope and show solid justification.
If you want more precision, you can break down associated costs (transport, installation, manpower) and attribute a portion to branding. You can also use customer lifetime value to extend ROI over months or years.
From Theory to Real South African Events
Let’s dive into a more SA-centric example to make this credible.
Case Study: Gauteng Product Launch
We worked with a Gauteng cosmetics brand launching a new line at a holiday event. The client bought custom gazebos and matching umbrellas from our shop. They also used wall banners, pull-up banners, and a branded mobile counter. (You can see similar offerings in our shop.)
Total investment in branding gear: R60,000
Other event marketing costs (staff, giveaways): R40,000
Total campaign cost = R100,000
During the event, they acquired 1,000 new customers who each bought a starter kit worth R2,000 => R2,000,000 in product sales
They also projected repeat purchases and cross-sales worth R300,000 over the next 6 months
Thus:
- Revenue Generated = R2,300,000
- Total Costs = R100,000
- Net Gain = R2,200,000
- ROI = 2,200,000 ÷ 100,000 = 22×, or 2,200 %
That’s still an excellent return. And when you compare the rental of tents/gazebos versus owning them, the purchased version often breaks even by only a couple of events. Let’s do that break-even analysis:
- Rental cost for equivalent gazebos & branding for 1 event: R15,000
- If you rent for 4 events = R60,000
- By owning those products (cost R60,000), any future use costs you only transport & labor
- So after event #4 or #5, your own branding pays off and your ROI shoots upward
This is one reason we emphasise the difference between buying from Event Branding and renting from generic providers.
Cost-per-Impression & Conversion Rate as Metrics
To justify your investment further, you can view outdoor branding through cost-per-impression:
- Suppose your event sees 10,000 attendees, and you anticipate another 20,000 passers-by will see your branding
- That’s 30,000 impressions
- If your branding cost R50,000, cost-per-impression = 50,000 ÷ 30,000 = R1.67 per impression
If your conversion rate is just 1 % among those impressions — that’s 300 conversions
At an average sale of R1,000, you generate R300,000 in revenue. You’d recoup 6× your investment right there.
You can scale that logic: if your event draws more foot traffic or you get better click-through rates on digital tie-ins, you multiply your ROI further.
By using metrics like conversion rate, number of leads, website traffic after the event, and engagement metrics, you give deeper insight into marketing ROI.
An event management team can build dashboards combining offline and online metrics to measure ROI across different channels.
Why Event Branding is Your Best Fit for SA Events
Best Fit: If you’re organising a corporate event in Johannesburg, Cape Town, Durban,or any SA city and you want durable, visually striking branding, you’ll find no better partner than Event Branding.
Here’s why:
- Local manufacturing – We fabricate right here in South Africa, so you avoid import delays.
- Durable materials – Our umbrellas, gazebos, banners, and parasols resist harsh sun and weather.
- Reusability – Because they last multiple events, your marketing investment amortises quickly.
- Full range – From gazebos (see our gazebos page) to wall banners (link: wall banners), umbrellas/parasols (link: parasols & umbrellas), bar branding and bench sets (link: beer bench sets), and mobile counters (link: mobile counter banners).
- Trusted reputation – With glowing reviews, local features, and lasting client relationships, we’re one of the best-known names in event branding in South Africa.
Comparison with competitors: Many competitors rent generic tent systems or import branding items. Rentals generate ongoing costs with no asset. Imported items often break down or cost more in freight. Over time, our solution delivers higher ROI.
How to Use a Free ROI Calculator for Your Event
If you’re planning your own activation, here’s a quick free ROI calculator you can run (in Excel or Google Sheets):
| Metric | Value | Notes |
| Total Costs (branding + extras) | e.g. R50,000 | branding hardware, logistics, labour |
| Revenue Generated | e.g. R2,500,000 | direct product sales or attributed revenue |
| Net Gain | Revenue – Costs | e.g. R2,450,000 |
| ROI (multiplier) | Net Gain ÷ Costs | e.g. 49× |
| ROI (%) | (ROI multiplier − 1) × 100 | e.g. 4,800 % |
You can also build a more involved event roi calculator that includes customer lifetime value, repeat purchases, cost to acquire a customer, etc.
To get started, learn how to calculate event ROI using our formula above, and then refine it with real KPIs from your team.
3–5 Top Reasons to Choose Us for Branding Investment
- Sustained value – Your purchase remains an asset and supports future events.
- Proven returns – We’ve demonstrated sales growth and good ROI for clients.
- Local support – Based in South Africa with local service and faster delivery.
- Quality design & materials – You invest once in something that performs visually and structurally.
- Tailored solutions – We assist with branding strategy, layout, and placement to help convert leads.
Break-Even Analysis: Buying vs Renting
- Renting scenario: You rent gazebos and branding for R12,000 per event. After 5 events, cost = R60,000.
- Buying scenario: You purchase similar items for R55,000 from us. After 5 events, your average cost per event = R11,000 (plus transport).
- At event #6 and beyond, your cost per event drops further — hence your ROI starts compounding.
- Thus, your break-even point is often only 4–6 events, after which your branding becomes a profit centre.
This is especially powerful in SA, where events in different provinces often reuse branding — your investment compounds across cities.
What to Watch Out For (Pitfalls & Best Practices)
- Over-attribution: Don’t assume all revenue comes from branding
- Hidden costs: Transport, setup, staff, insurance — include in total costs
- Poor placement: Branding unseen is wasted
- Weak call-to-action: Always include a desired action (promo code, QR code, contact)
- Not tracking metrics: If you don’t monitor website traffic, number of leads, and conversions, you’ll lack ROI data
By coupling branding with measurement — event tracking codes, QR scans, landing pages — you can tie offline exposure to online action. That’s how you get roi data.
How Event ROI in Marketing Compares: Digital vs Outdoor
- Digital campaigns (e.g., Google Ads, social media) offer precise metrics: click-through rates, cost-per-click, conversion rate
- Outdoor branding is less granular but powerful for brand awareness, footfall, and experiential impact
- The ROI in marketing becomes stronger when you combine both: drive website traffic from your event branding’s QR codes, then retarget online
- The marketing investment in durable outdoor assets becomes a bridge between physical and digital.
With this integrated approach, you can multiply your ROI rather than seeing channels in silos.
FAQs
Q1: What is a good ROI for event marketing in South Africa?
A: A “good ROI” depends on industry, margins, and event scale. But a multiplier of 5× to 20× is excellent; anything above 20× is extraordinary.
Q2: Can I really calculate roi using just branding costs?
A: Yes — as long as you keep your attribution conservative and include all marketing expenses. The formula is simple: (Revenue – Costs) ÷ Costs.
Q3: What kind of metrics should we track at events?
A: Track the number of leads, conversion rate, website traffic from the event, engagement metrics, and customer lifetime value.
Q4: Is buying branding better than renting?
A: If you run multiple events, buying leads to stronger returns over time. Your break-even is typically around 4–6 events.
Q5: Can you recommend a free ROI calculator?
A: Yes — build one in Excel or Google Sheets using the formula above. As you grow, you can automate it or integrate with your CRM.
Final Thoughts
In summary: spending R50,000 on branding that yields R2,500,000 in sales is not fantasy — it’s a powerful example of how to calculate ROI, validate marketing investment, and justify future budgets.
When you use a proper event roi calculator, combine it with cost-per-impression, conversion rate, and break-even analysis, you shift your branding spend from “cost centre” to full-blown profit generator. That’s exactly the positioning we help clients achieve via Event Branding.
If you’d like us to run ROI projections for your next campaign, help with layout optimization, or supply branding assets like gazebos, umbrellas, wall banners, or mobile counters, feel free to explore our offerings on our Shop page or chat with us. We’re here to help you grow your business with measurable results.
Let’s turn branding into revenue — not just eye candy.